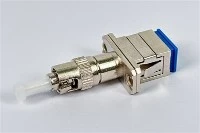
Fiber connector quality is not defined by one low insertion-loss result. For a pigtail connector to remain predictable in production and in service, its ferrule alignment, polished geometry, optical distribution and resistance to stress must support the same conclusion. A supplier that reports only the best IL value has shown that one specimen mated well once, not that the delivered population will mate consistently.
The practical question is not "Did this connector pass?" It is "What evidence shows that this lot will keep passing when randomly mated, handled and aged?" That turns a nominal specification into a measurable fiber connector quality acceptance method.
One Passing Result Is Not a Quality System
A defensible decision uses four linked evidence layers. Each layer controls a different failure mechanism, and a strong result in one layer cannot cancel a missing result in another.
| Evidence layer | What it measures | Evidence to request | What a weak report hides |
|---|---|---|---|
| Ferrule precision | Bore fit, concentricity and core position | Ferrule/core metrology and lot distribution | A lucky orientation against a master connector |
| End-face geometry | Radius of curvature, apex offset and fiber height | Interferometer records by connector type and polish | Unstable physical contact or excessive contact stress |
| Optical performance | IL and RL under a defined mating method | Wavelength, launch condition, reference method, random-mate population and sample size | A single golden-unit value |
| Reliability | Change after thermal, humidity, mechanical and mating stress | Before/after IL and RL with limits, samples and failures | Initial compliance that drifts in service |
This four-layer model is the minimum useful structure for fiber connector quality standards because it separates a cause, its optical symptom and its behavior after stress. Without that connection, a buyer cannot distinguish controlled manufacture from favorable mating.
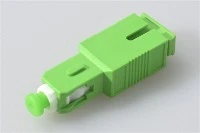
Interface compatibility remains a separate gate. A consistent SC/APC connector can still be wrong for a UPC port, another fiber type or incompatible keying. Our fiber pigtail connector compatibility guide covers that decision.
Ferrule Precision Sets the Mechanical Floor for Fiber Connector Quality
The ferrule's bore diameter, bore-to-outer-diameter concentricity, fiber-to-bore clearance and core-to-cladding eccentricity combine into the lateral offset at the interface. Fiber connector quality for pigtails begins here because polishing cannot correct a mechanically off-axis core.
Bore clearance creates the first alignment uncertainty. A larger bore makes fiber insertion easier, but it permits more lateral movement before the adhesive cures. With a 125 μm fiber, the permitted bore and tolerance must be treated as a production capability question, not a catalog label. A visible crescent-shaped epoxy ring around the fiber after polishing is a practical warning that the fiber cured off-center in an oversized bore. It is a diagnostic signal, not a dimensional measurement, so it should trigger ferrule/core metrology and a review of the random-mate IL distribution.
Concentricity controls whether the bore follows the ferrule OD; core eccentricity controls whether the optical core follows the cladding. The errors can add or cancel in one orientation, so a reference-grade master cord can make marginal fiber connector quality look better than random production mates.
For procurement, request the ferrule drawing, actual lot distribution and the method used to measure bore and concentricity. A maximum limit without a distribution cannot show process centering. For tuned connectors, also ask whether orientation was controlled and whether the reported loss assumes alignment to a keyed direction. The 2024 edition of IEC 61755-3-1 defines dimensional limits for single-mode PC interfaces using 2.5 mm and 1.25 mm zirconia ferrules; APC interfaces are covered separately by IEC 61755-3-2.
End-Face Geometry Converts Alignment into Fiber Connector Quality
Ferrule precision brings the cores into lateral alignment. Polished geometry determines whether they maintain physical contact under spring force. Fiber pigtail connector quality standards must therefore identify connector family, ferrule size, polish and governing edition before quoting a geometry range.
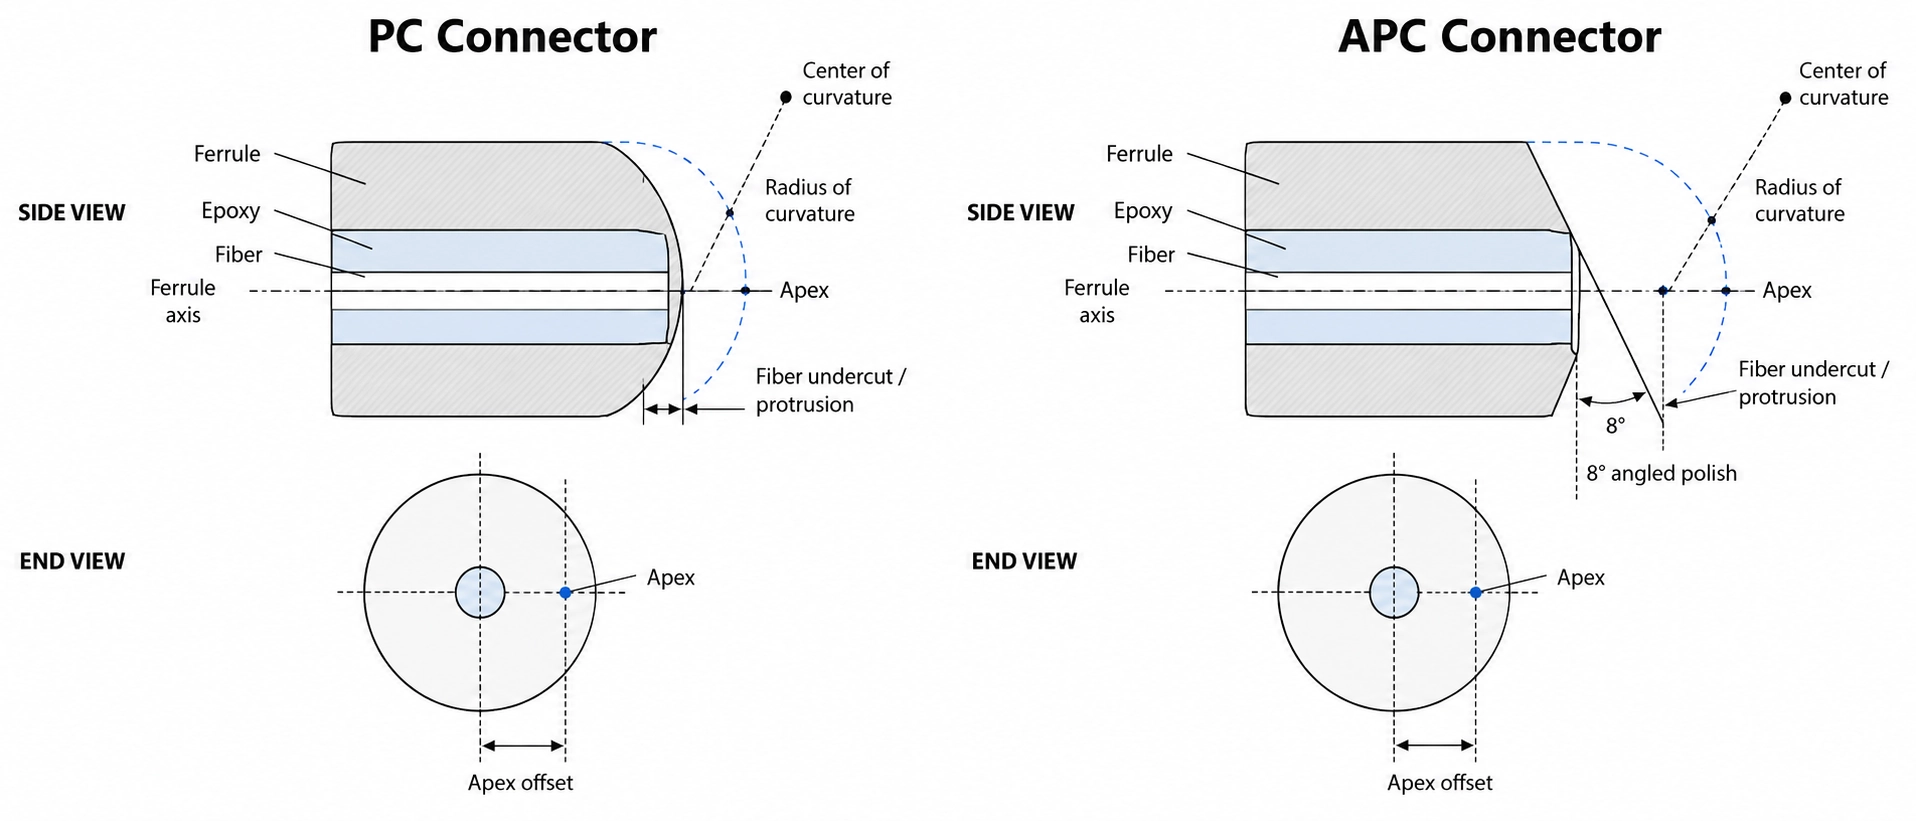
IEC 61300-3-47 describes interferometric measurement of a spherically polished ferrule or connector. The output normally includes radius of curvature, apex offset and fiber height. These values must be reviewed together; none is a stand-alone certificate of good contact.
Radius of Curvature
Radius of curvature, or ROC, describes the curvature of the polished ferrule surface. A radius that is too small concentrates contact force near the fiber, while a radius that is too large can reduce the ability of the interface to maintain reliable core contact when tolerances stack.
Typical GR-326-style acceptance plans may use ranges such as 7–25 mm for UPC and narrower connector-specific ranges for APC, but those figures are examples rather than universal limits. The correct ferrule end face geometry specifications must come from the applicable interface standard, customer specification and qualified process. A report that gives only "ROC pass" without the numerical result, instrument settings and interface definition is not enough to assess fiber connector quality.
Apex Offset
Apex offset is the distance between the fiber axis and the highest point of the polished spherical surface. Excessive offset moves the contact-force center away from the fiber, increasing the risk that the cores will not maintain controlled physical contact through repeated mating or environmental change.
A limit around 50 μm appears in many cylindrical PC/APC control plans, but it should be treated as an interface-specific reference, not copied blindly into every RFQ. For fiber connector quality testing, request the measured distribution and maximum by lot. A mean near the limit indicates a drifting polishing process even if every sampled unit technically passes.
Fiber Height
Fiber height states whether the glass protrudes above or withdraws below the fitted ferrule surface. Excessive protrusion raises contact stress and damage risk; excessive undercut can prevent reliable glass-to-glass contact. Adhesive cure, polishing film sequence, pressure, fixture condition and fiber material all affect the result.
The important purchasing distinction is between a dimensional window and a centered process. If a supplier's results cluster near one boundary, the process has less margin for tool wear and lot variation. Fiber connector quality acceptance criteria should therefore include sample count, mean, spread and extreme values, not just pass/fail screenshots.
Fiber Connector Quality Testing: IL and RL Need a Defined Method
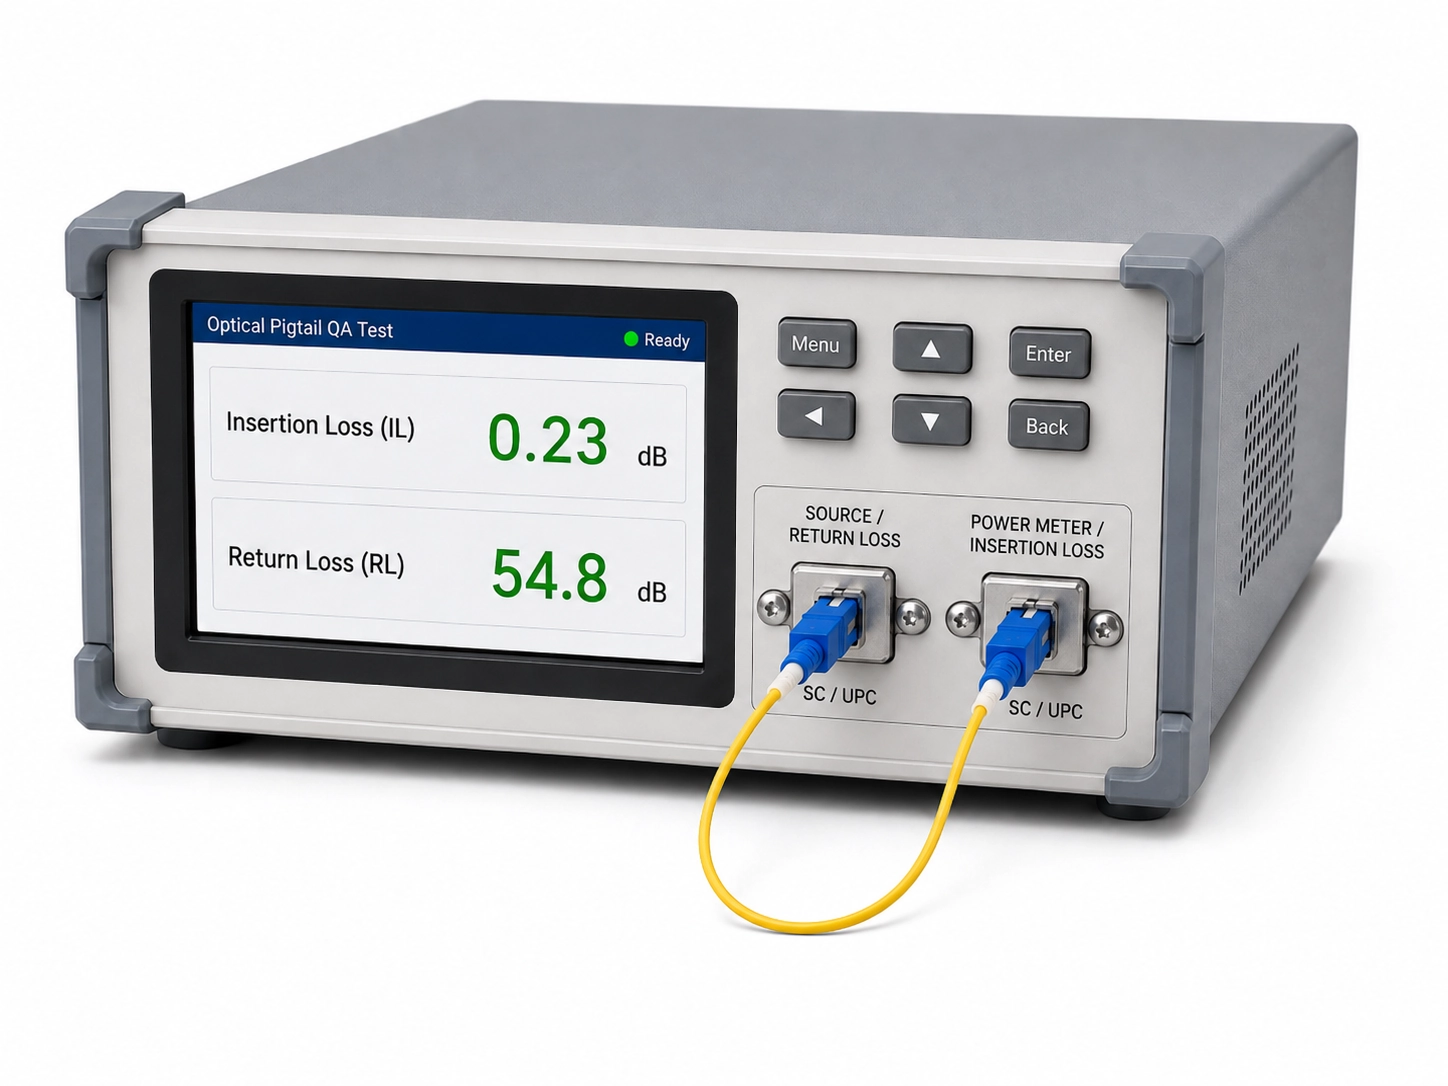
Insertion loss measures optical power lost through the connection; return loss expresses how little power is reflected back toward the source. Lower IL and higher RL are generally desirable, but the number is interpretable only when the test configuration is stated. Fiber connector quality testing must define wavelength, launch condition, reference method, test-cord grade, cleaning state, mating population and sample size.
The difference between reference mating and random mating is decisive. A pigtail measured once at 0.18 dB against a low-loss master cord has demonstrated that specific pairing. It has not demonstrated the distribution customers will see when production connectors mate with other production connectors. IEC 61300-3-34 addresses the statistical distribution and mean attenuation of random-mated connectors.
| Reported claim | What it actually supports | Evidence needed for approval |
|---|---|---|
| "IL ≤0.3 dB" | A limit with unknown method | Wavelength, reference method, samples and all results |
| One reference-mate result | Performance against one controlled interface | Multiple mates or a justified production-control method |
| Grade B attenuation claim | A statistical performance class | Applicable IEC edition, random-mate population and distribution |
| "RL ≥60 dB" | Reflection result in an unspecified condition | Polish, wavelength, cleaning state, method and minimum result |
Grade language should be used carefully. A common interpretation for single-mode random-mated attenuation classes places Grade B at a mean of no more than 0.12 dB with a 97% value no more than 0.25 dB, Grade C at 0.25/0.50 dB and Grade D at 0.50/1.00 dB. Verify the purchased IEC document and project specification before putting those values into a contract. A single result cannot prove a statistical grade.
Return loss requires the same discipline. APC interfaces are often selected where reflection sensitivity matters, but polish color or an "APC" label does not prove the stated fiber connector return loss requirements. The report should identify the minimum result, wavelength, test method, cleaning condition and whether the measurement represents the complete pigtail path or the connector interface alone.
When an order still relies on a single IL ceiling, define the measurement before negotiating a lower number. Our nine-spec pigtail RFQ checklist shows how to state mating method, grade, wavelengths and evidence so that competing quotations describe the same fiber connector quality requirement.
A Clean End Face Does Not Prove Fiber Connector Quality
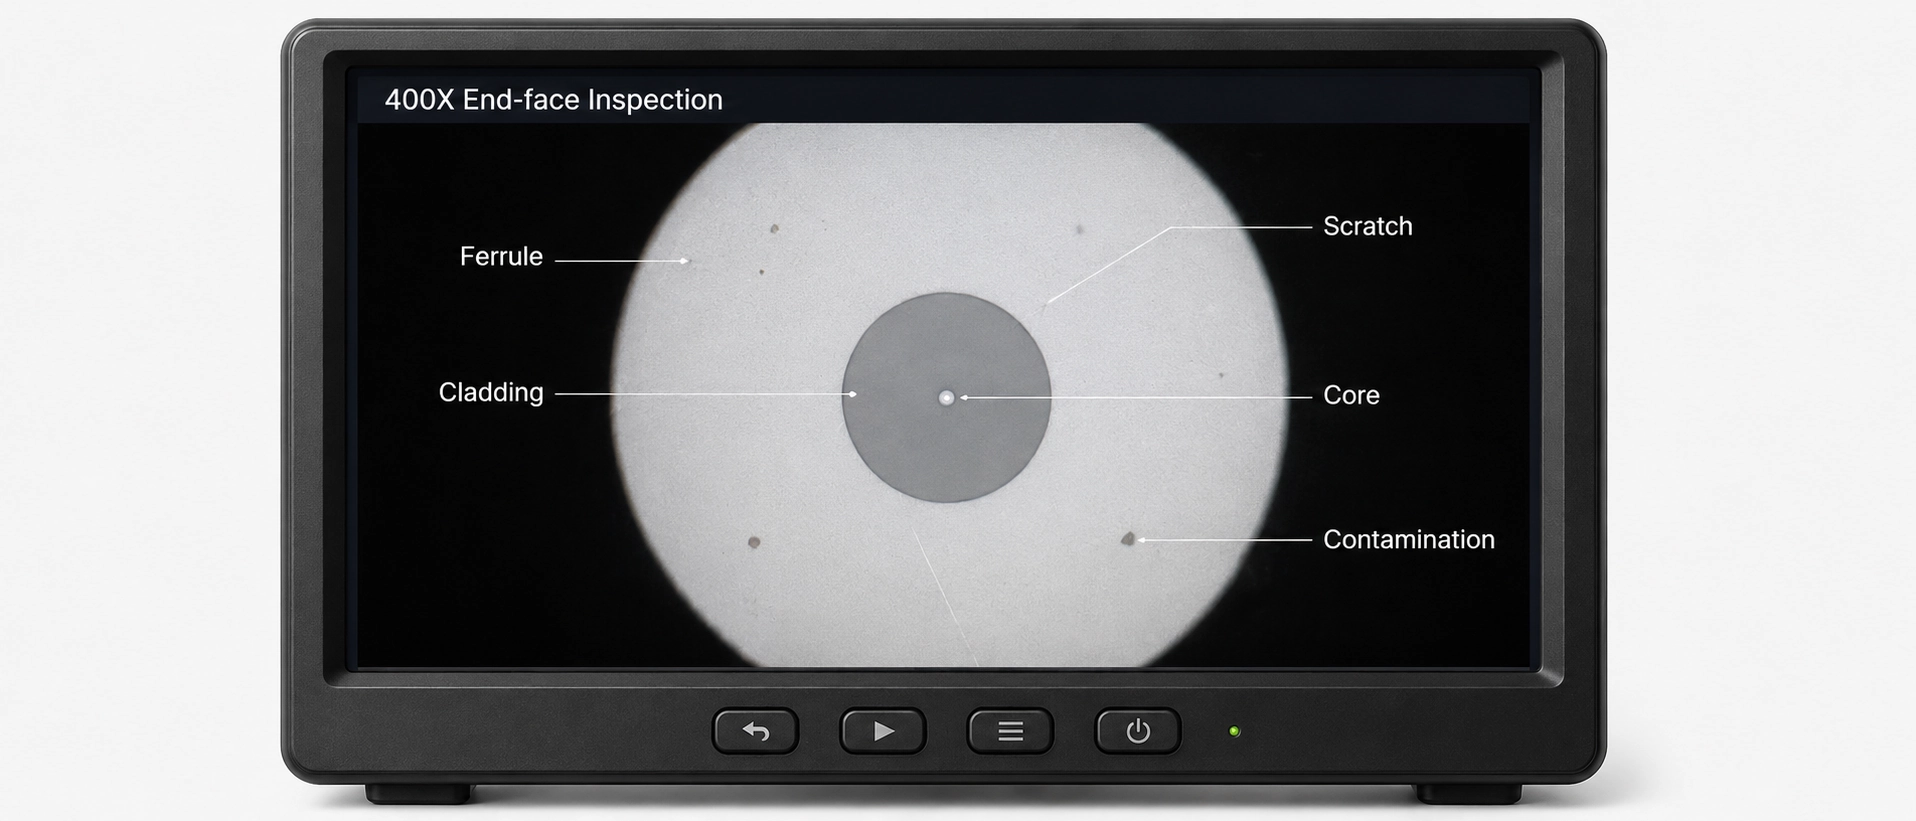
Visual inspection and cleaning answer only whether the observed surface contains unacceptable debris, scratches or defects. IEC 61300-3-35:2022 covers their classification; it does not replace geometry, random-mate IL/RL or reliability evidence.
Contamination can also act outside the microscope's central inspection zones. Debris on the ferrule outside diameter or inside an adapter sleeve can shift the ferrule axis even when the fiber region looks clean. In assembly, one common path is epoxy or release-agent residue transferred from a technician's glove or finger to the ferrule OD during handling. That residue can disturb centering in the split sleeve without appearing as a core-zone particle.
Reflection can deteriorate before insertion loss gives a clear warning. An iNEMI study summarized by EXFO reported that oil contamination changed return loss by an average of 10–12 dB while insertion loss showed no significant change; the contaminated connection also degraded 10 Gbit/s BERT performance (EXFO application note). This is the risk buyers often miss: a connector can pass a familiar IL limit while contamination has already damaged its reflection performance.
The control sequence is inspect, clean if required, and reinspect before optical testing. Record the inspection criterion and cleaning state with the IL/RL result. Our IEC-based pigtail inspection guide explains the visual decision process, while the acceptance record should keep inspection, geometry and optical evidence as distinct fields.
Fiber Connector Quality After Thermal and Mechanical Stress
Reliability is the ability to retain optical performance after a defined stress, not simply to survive without visible damage. Fiber connector reliability testing should report the initial result, post-stress result and change in IL and RL for every sample, together with conditioning, recovery time and failures.
Temperature cycling exposes differential expansion and adhesive movement; damp heat reveals moisture sensitivity; vibration, flexing, retention and shock probe load transfer. Mating durability reveals wear and debris. Each stress isolates a different weakness, so "GR-326 tested" without a sequence, sample count and acceptance delta is not useful evidence of fiber connector quality.
Telcordia GR-326 qualification is commonly used in North American connector programs, but buyers should distinguish full qualification, family qualification and a supplier's internal test inspired by the standard. Request the issue, applicable test group, environmental conditions, number of samples and complete before/after data. A certificate without the underlying test definition cannot establish GR-326 connector qualification.
Indoor FTTH and ODF Pigtails
For controlled indoor distribution frames, repeatable mating, handling cleanliness, bend management and stable post-splice performance often dominate. The connector still needs qualified geometry and optical distribution, but an outdoor sealing claim should not distract from the evidence that technicians will actually depend on. Fiber connector quality for pigtails in this setting should be reviewed together with the splice and routing acceptance plan.
High-Speed or Reflection-Sensitive Links
In high-speed data-center, analog RF, coherent or monitoring links, reflection control can be as important as insertion loss. The contamination case above shows why a familiar IL result cannot serve as a proxy for RL. Here, the acceptance plan should make APC/UPC compatibility, minimum RL, inspection condition and repeated-mate behavior explicit.
Outdoor, Industrial or High-Humidity Installations
Outdoor and industrial pigtails need evidence tied to actual temperature, humidity, vibration and handling conditions. Field failure investigations by NTT found scratched fibers, fractures in mechanical splice sections, incorrect fiber lengths, poor cleaves and incorrect joining, showing that assembly and installation controls remain part of the reliability chain (NTT Technical Review). For these deployments, fiber connector quality standards should connect component qualification to enclosure, routing and installation controls.
After installation, connector evidence must be separated from link evidence. A pigtail can leave the factory compliant and then acquire splice loss, bend loss or contamination in the field. Our post-splicing pigtail test guide explains how to distinguish those acceptance stages.
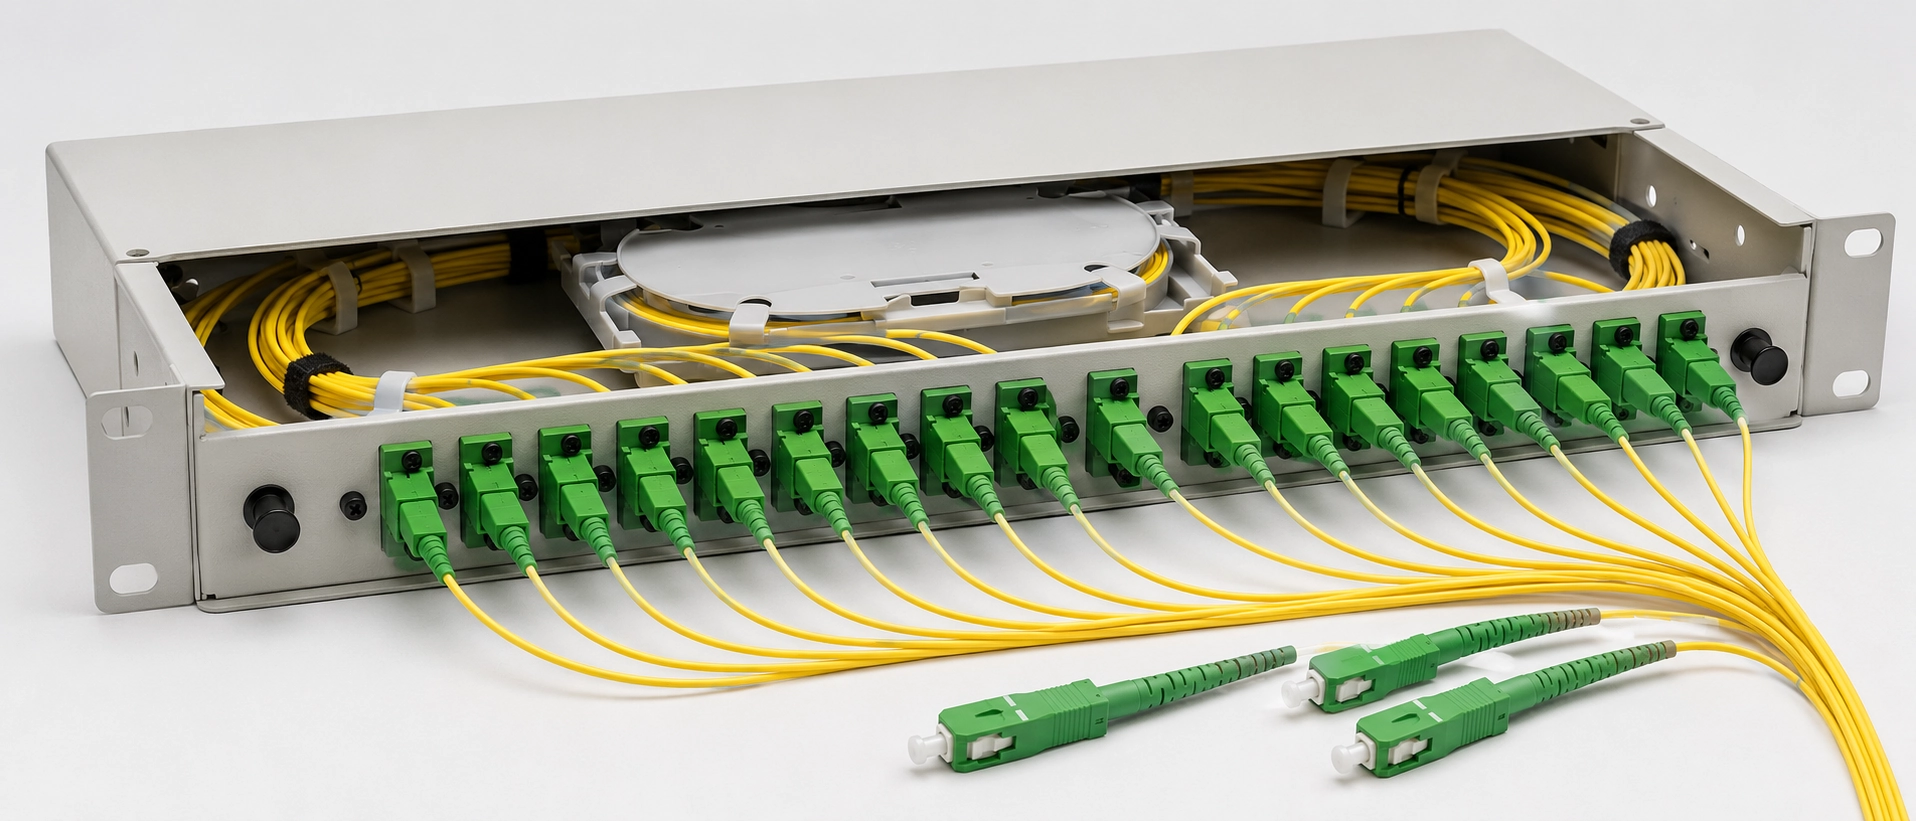
The Fiber Connector Quality Evidence Package for Supplier Approval
A supplier file lets an engineer reconstruct the decision. For how to test fiber connector quality, request records, not averages.
| Evidence item | Minimum content | Review trigger |
|---|---|---|
| Product definition | Connector, polish, ferrule size, fiber type, cable structure and applicable standards | Mixed interfaces or missing standard editions |
| Ferrule data | Bore/concentricity method, lot, sample count, distribution and maximum | Only catalog tolerances |
| Geometry data | ROC, apex offset and fiber height by sample, instrument and calibration status | Pass/fail images without values |
| IL/RL data | Wavelength, reference method, launch condition, mates, samples and complete distribution | Best value or average only |
| Inspection record | Criterion, magnification/automation method, cleaning state and result | "100% inspected" with no acceptance rule |
| Reliability record | Test sequence, conditions, samples, initial/final IL/RL, deltas and failures | Certificate with no underlying results |
| Traceability | Lot, date, work order, equipment and calibration references | Results cannot be tied to shipped goods |
The missing field is often more informative than the polished certificate. If a supplier will not state mating population, sample size or standard edition, the buyer cannot reproduce the claim. That is a fiber connector quality governance problem even when the reported numbers look strong.
For a pre-production order, freeze the evidence matrix with the drawing and control plan, then use the same fields for first-article approval and lot release. A manufacturer should be able to map ferrule selection, polishing, interferometer inspection, optical test and traceability to the connector being quoted. Our fiber optic connector manufacturing page provides the appropriate route for discussing that evidence against a specific interface and volume.
The Practical Fiber Connector Quality Acceptance Rule
Do not approve a fiber pigtail connector from its best measured value. Approve it from the weakest missing link in its quality evidence. Good geometry without random-mate optical data leaves interchangeability unproven; low initial IL without stress deltas leaves reliability unproven; clean end-face images without geometry leave physical contact unproven.
The final fiber connector quality decision should therefore be reproducible: another engineer should be able to identify the applicable interface, inspect the measurement method, review the lot distribution and verify the post-stress change. If that cannot be done, the evidence package is incomplete, regardless of how attractive one IL number appears.
To define a pre-production acceptance matrix, send the connector type, polish, fiber mode, wavelength, deployment environment, intended mating population and order volume. Those inputs determine which geometry, IL/RL and reliability records belong in the approval package; the limits should be agreed before samples are selected.
Frequently Asked Questions
How do you test fiber connector quality?
Test ferrule and end-face geometry, inspect and clean the interface, measure IL/RL under a stated reference or random-mate method, then verify changes after applicable environmental and mechanical stress.
What is the difference between reference-mate and random-mate insertion loss?
Reference mating measures against a controlled test interface, while random mating estimates the statistical performance of production connectors paired with other production connectors.
Can a connector have low insertion loss but poor return loss?
Yes. Contamination, gaps or reflection-sensitive defects can degrade RL while IL remains inside a familiar acceptance limit.
Which end-face geometry parameters should a supplier report?
For cylindrical PC or APC ferrules, the report should normally include radius of curvature, apex offset and fiber height under the applicable interface specification.
Does a clean microscope image prove fiber connector quality?
No. It supports surface inspection only and does not prove ferrule alignment, end-face geometry, random-mate optical distribution or post-stress stability.
What should a GR-326 reliability report contain?
It should identify the issue and test group, conditions, sample count, initial and final IL/RL, performance changes and any failures.